Chapter 11 Results
11.1 Gene expression
11.1.1 Liver
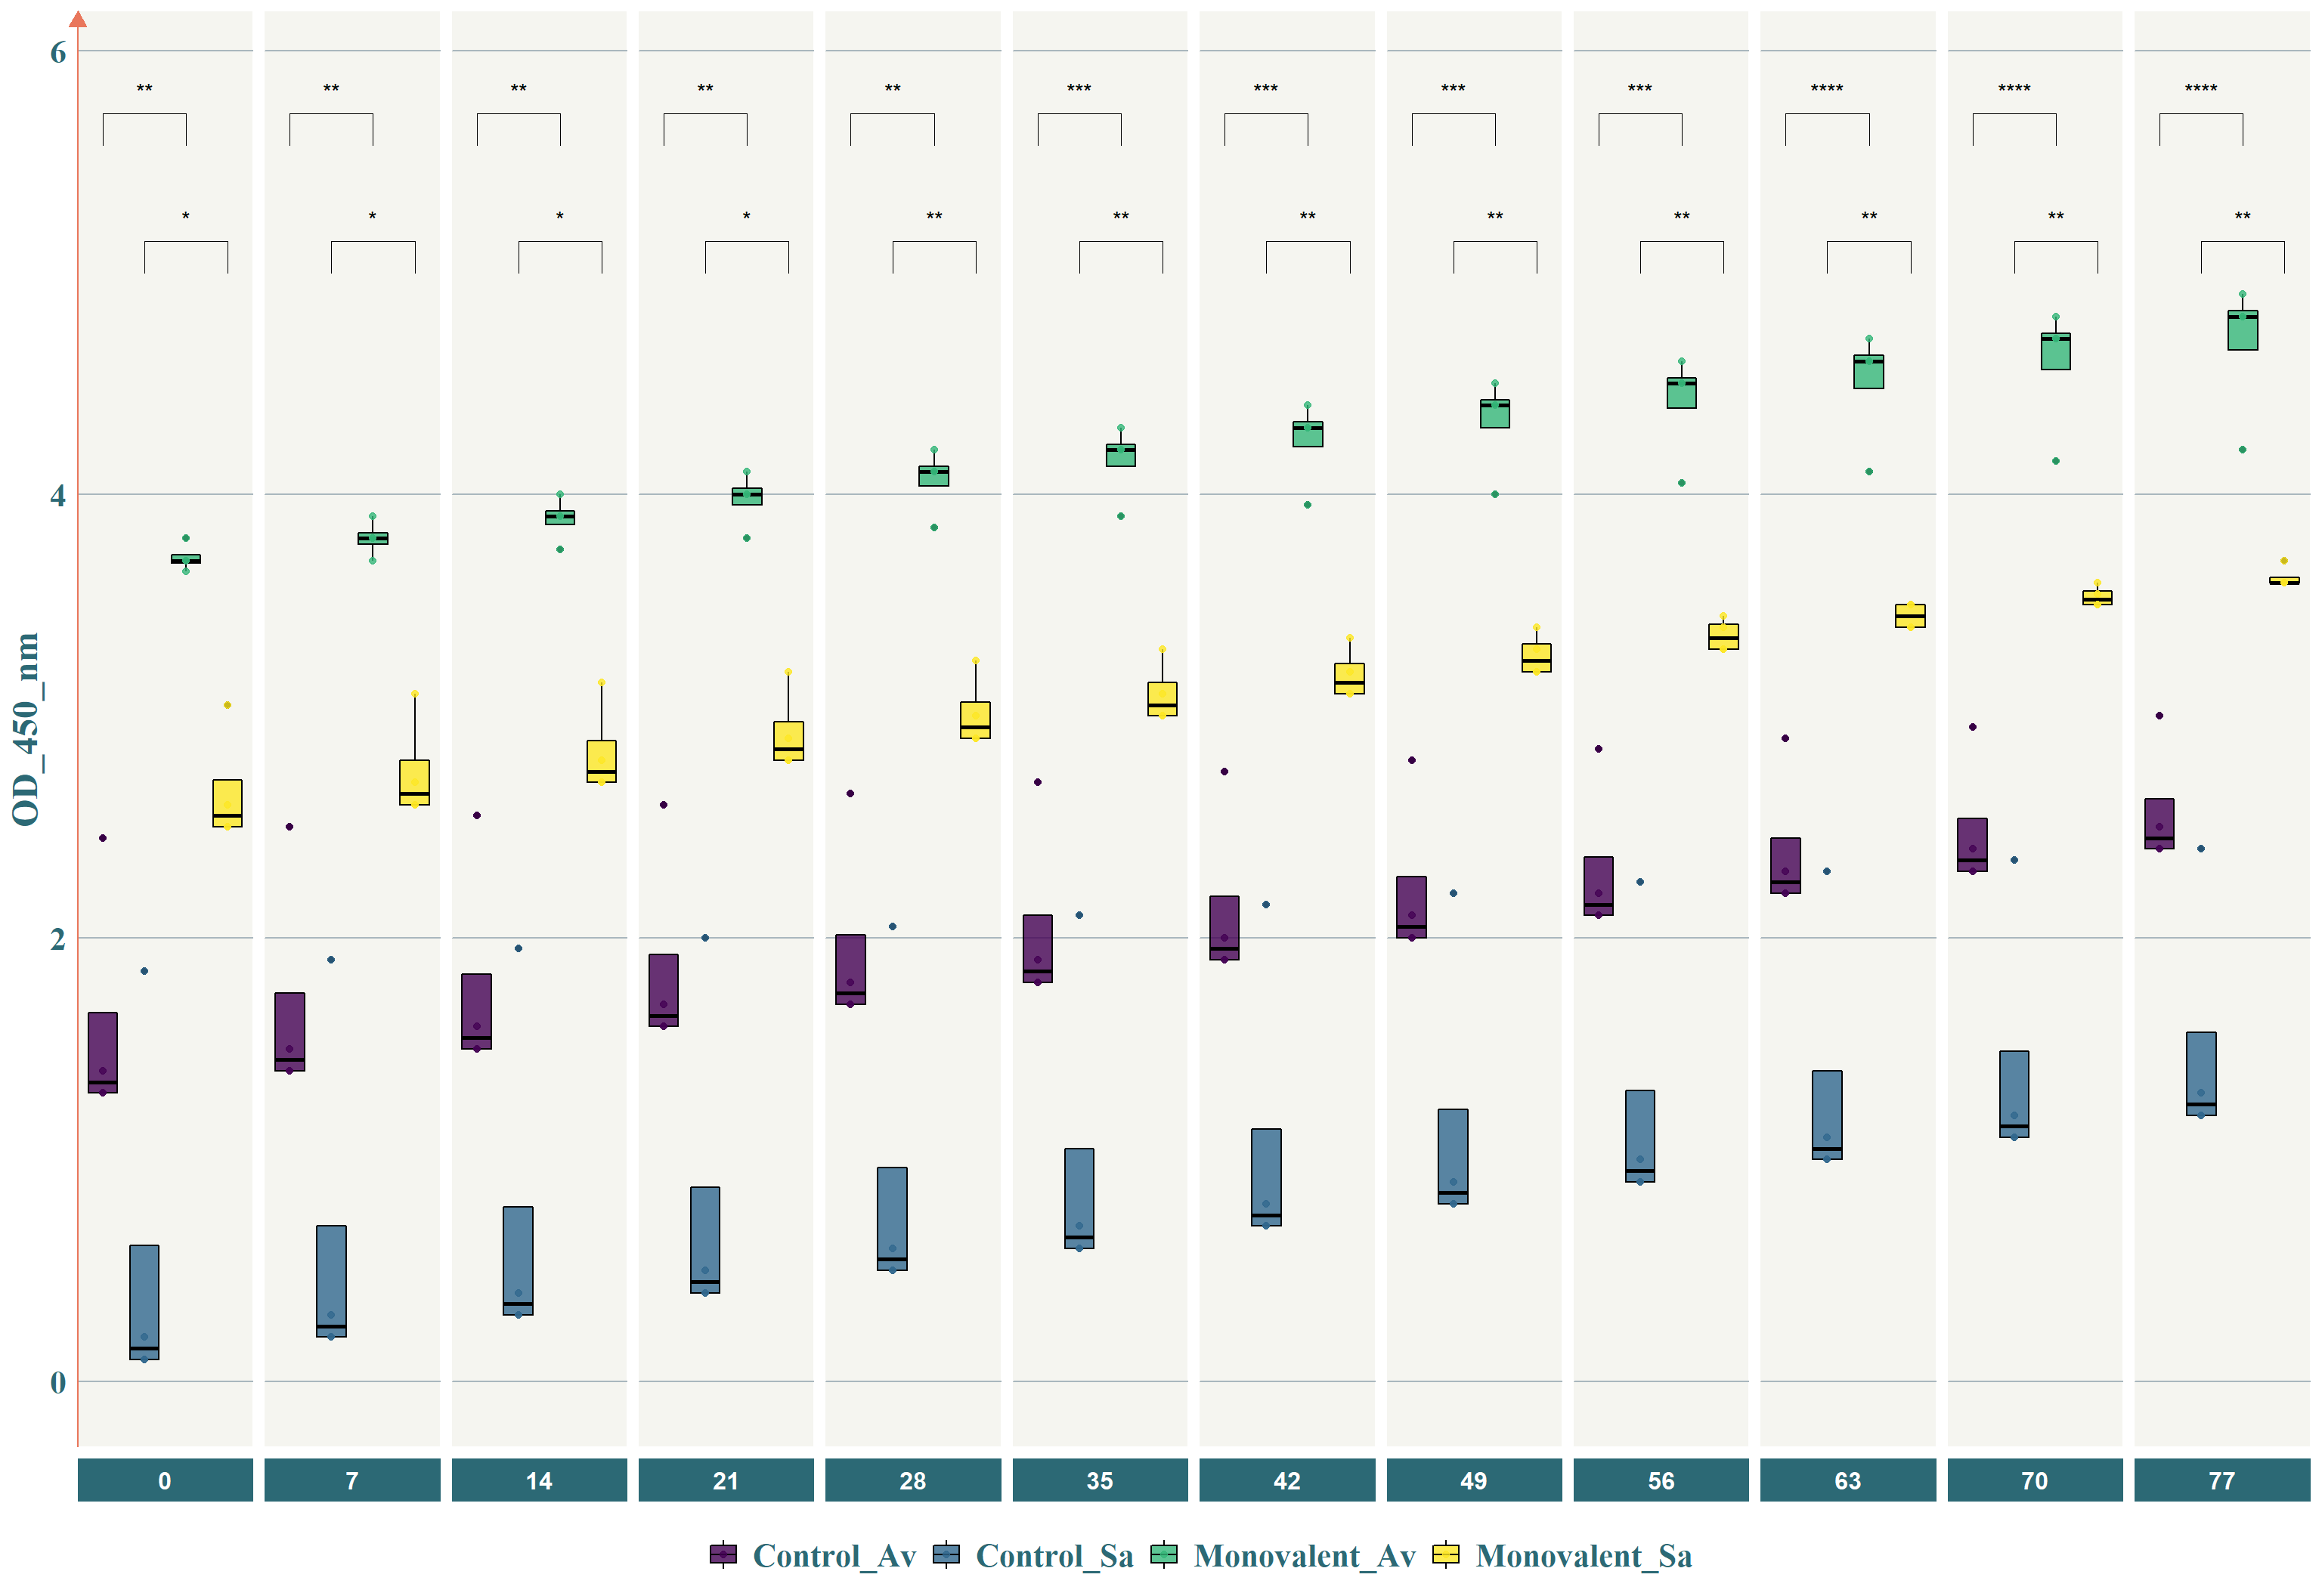
Figure 11.1: Gene expression in Liver after RT-PCR
11.1.2 Headkidney

Figure 11.2: Gene expression in Headkidney after RT-PCR
11.2 Systemic antibody response
11.2.1 Monovalent vaccines
Figure 11.3: Systemic antibody response (IgM) to monovalent vaccines
11.2.2 Bivalent vaccine
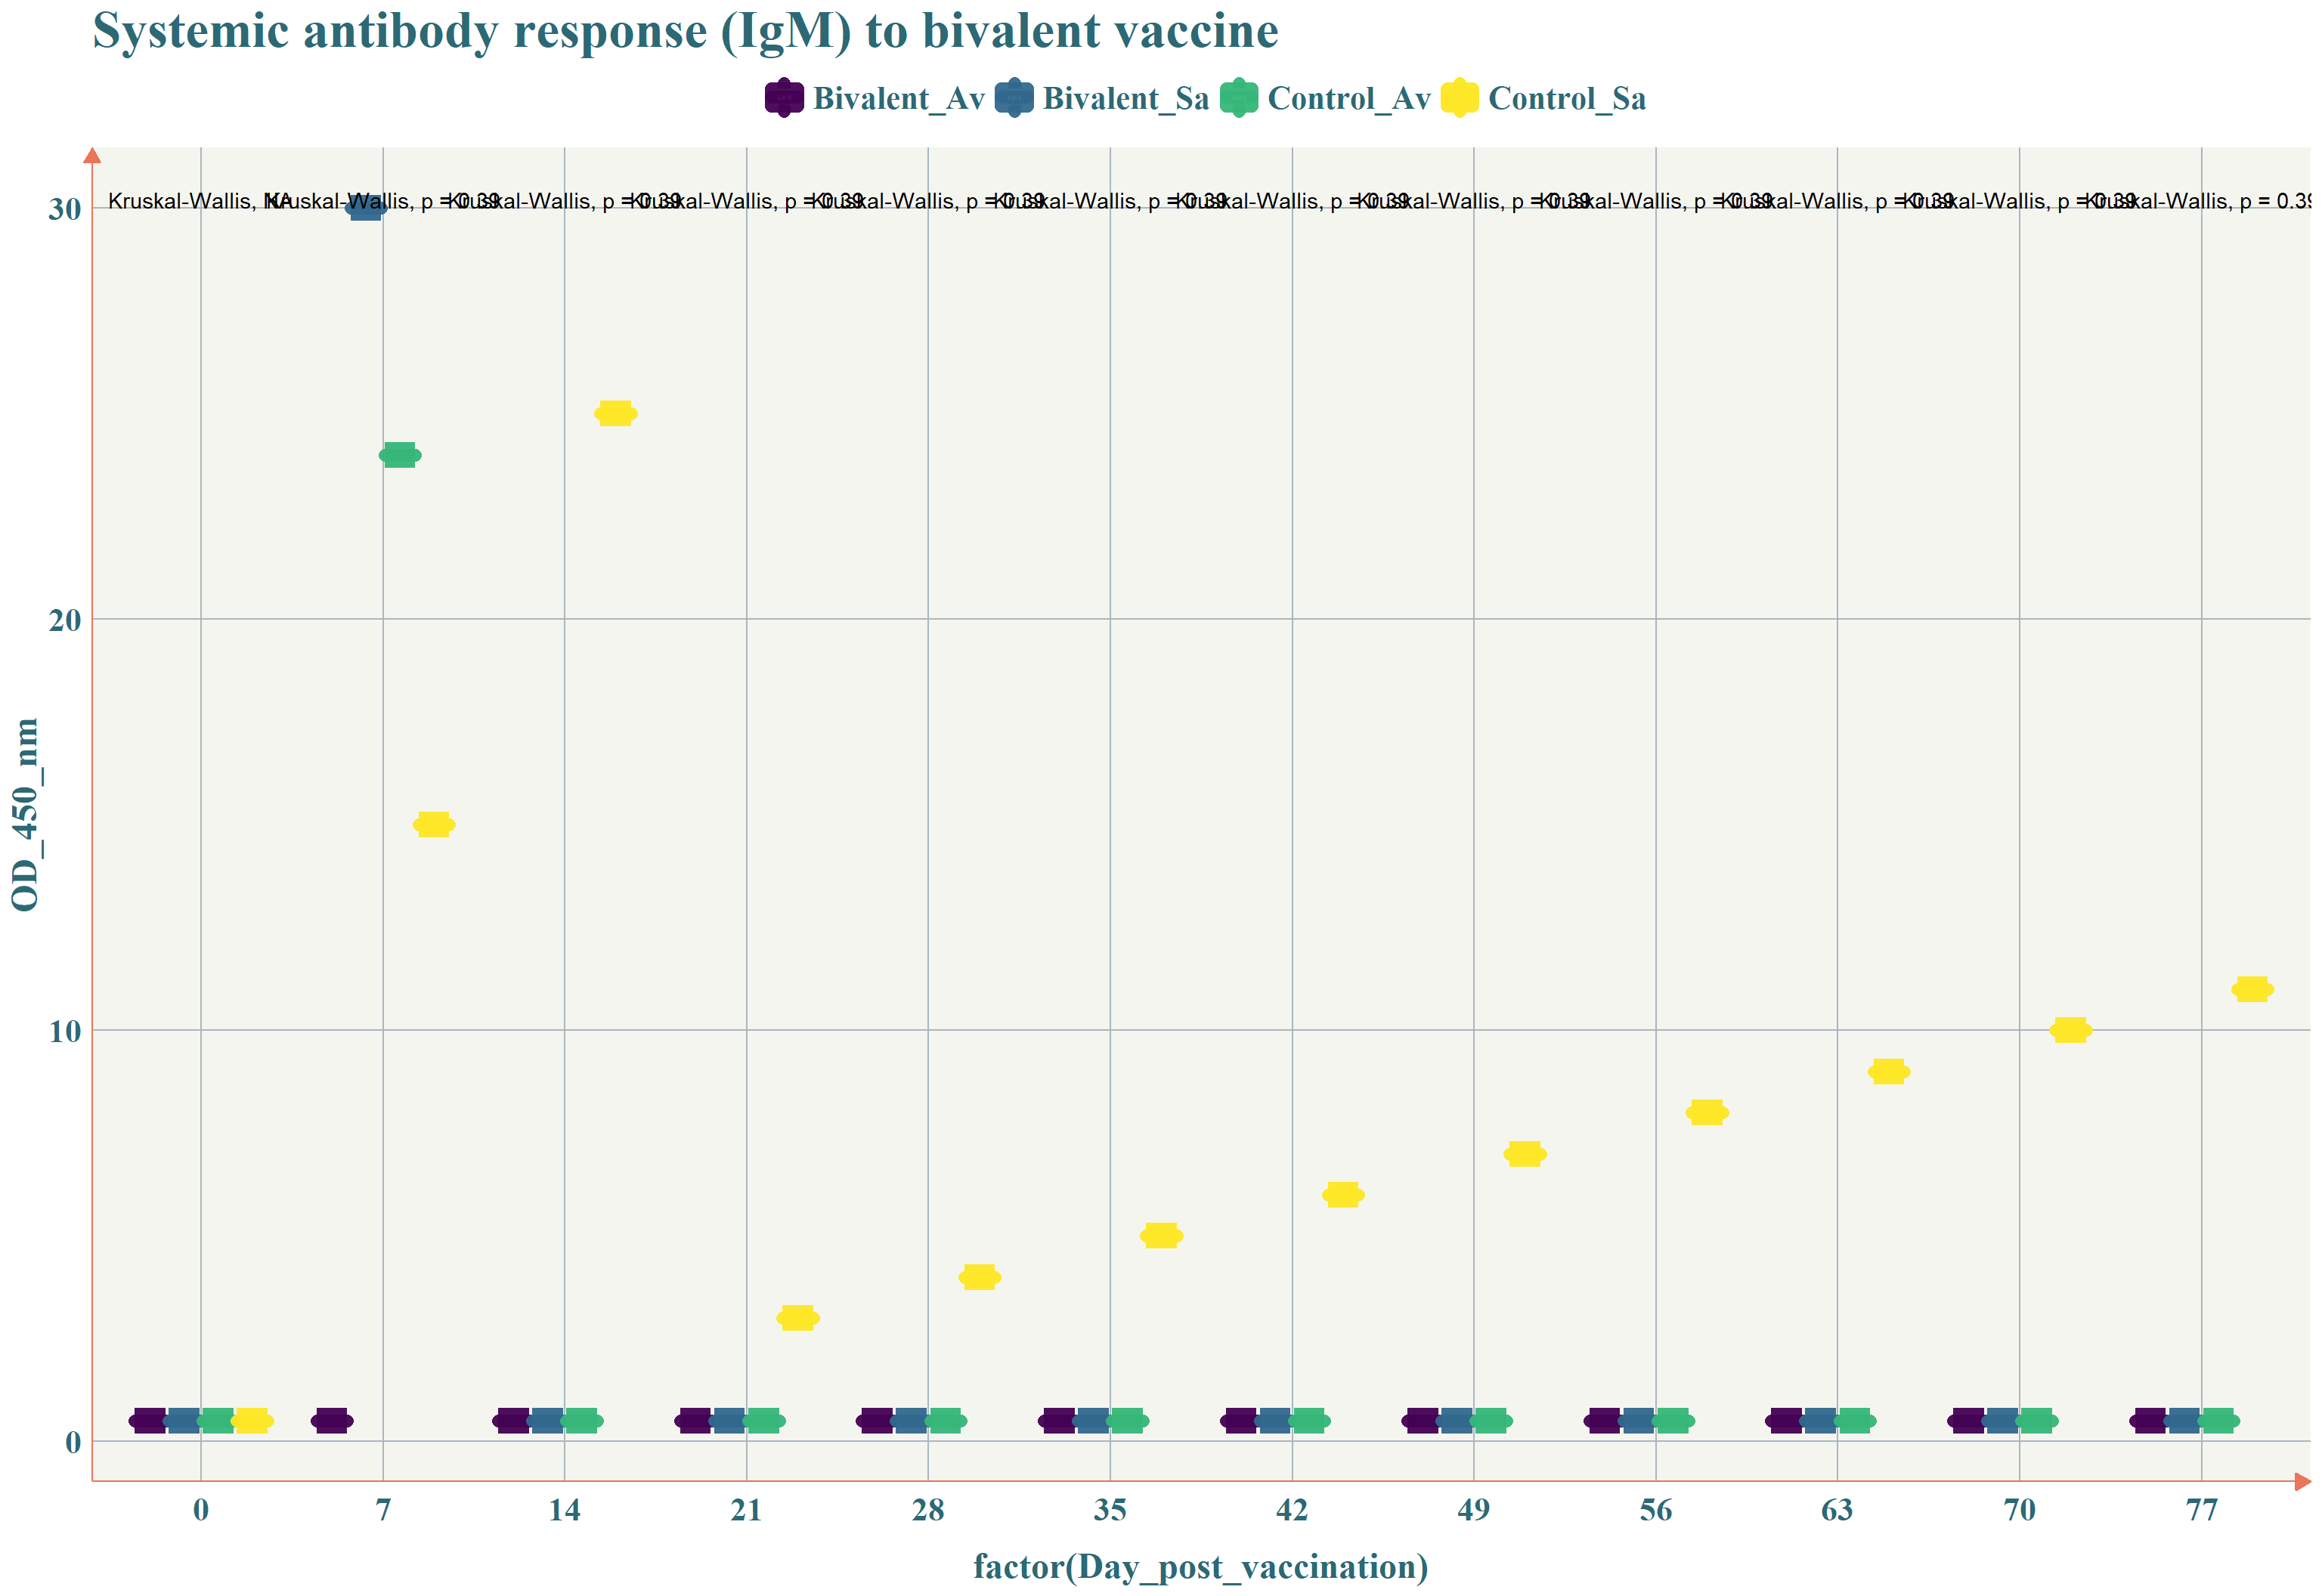
Figure 11.4: Systemic antibody response (IgM) to bivalent vaccine
11.3 Mucosal antibody response
11.3.1 Monovalent vaccines

Figure 11.5: Mucosal antibody response (IgM) to monovalent vaccines
11.3.2 Bivalent vaccine
Figure 11.6: Mucosal antibody response (IgM) to bivalent vaccine
11.4 Challenge test 1 (Unique)
11.4.1 Relative percentage survival (single dose)

Figure 11.7: Survival rates of samples of 20 fish Nile tilapia challenged 4 weeks after immunization with a single vaccine dose or with a control (PBS)
11.4.2 Kaplan-Meier survival estimates for the first challenge test
Monovalent versus bivalent formulations
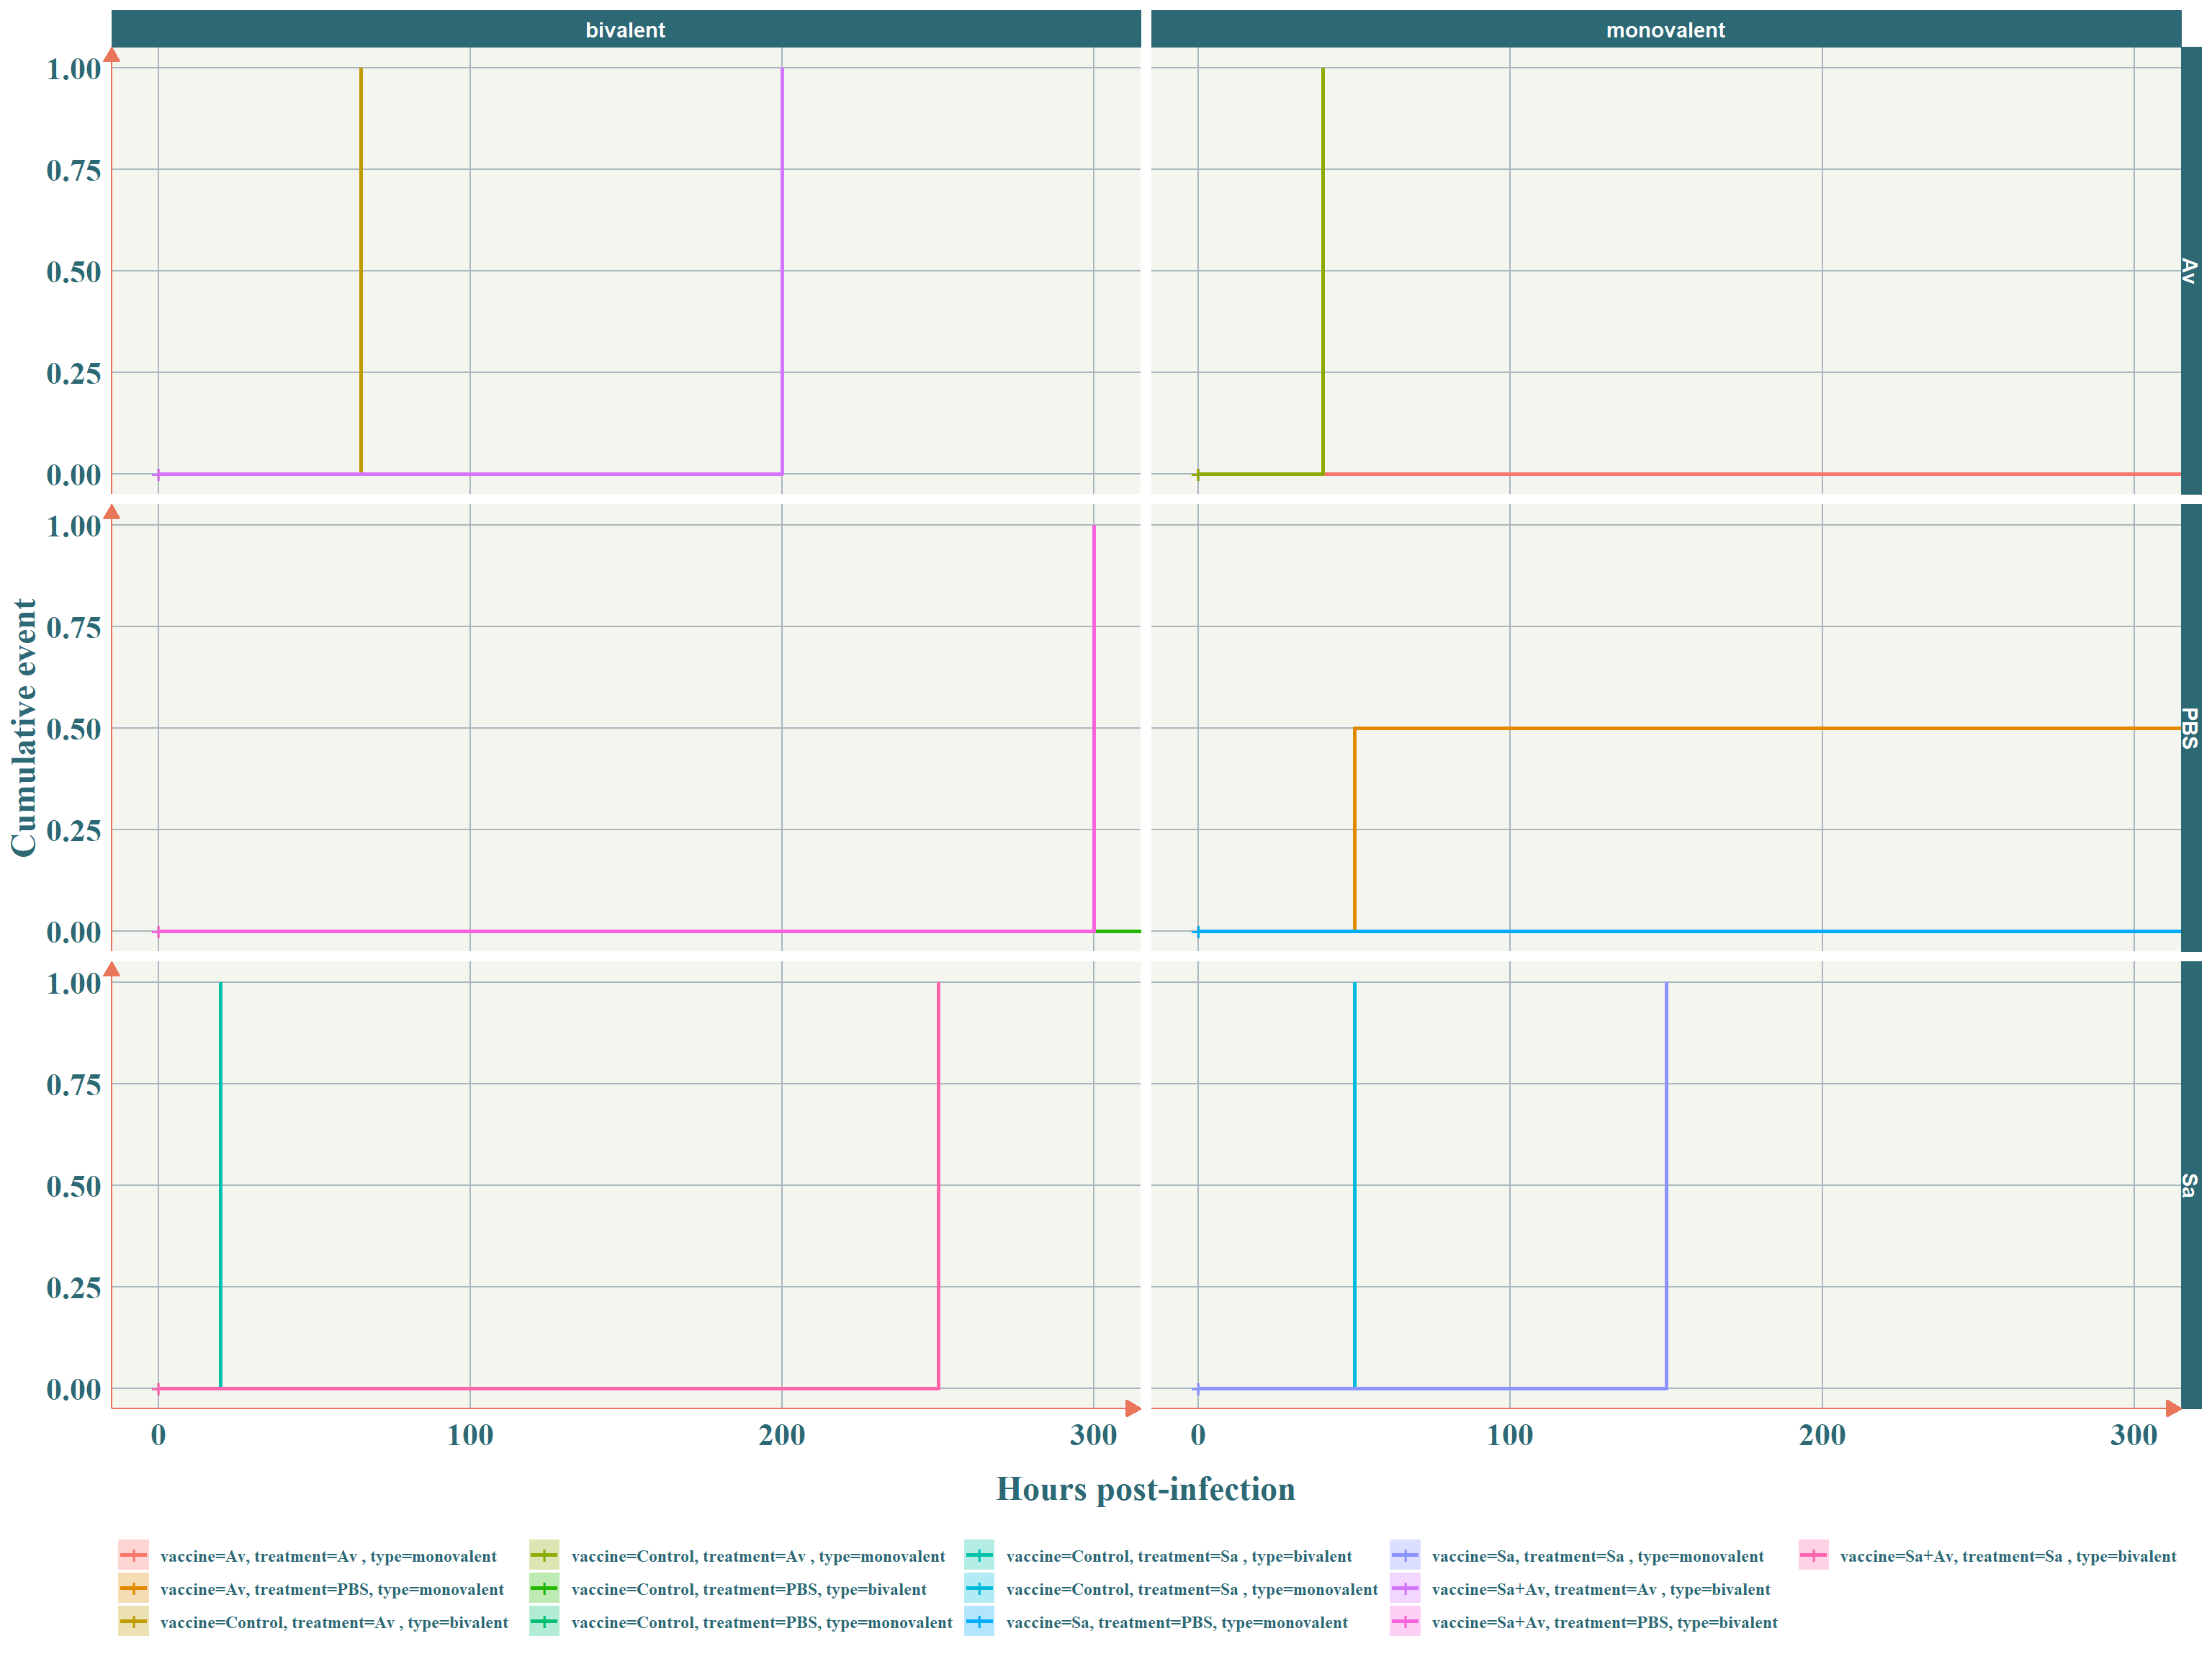
Figure 11.8: Survival curves using the combination of multiple factors. 20 fish Nile tilapia were challenged 4 weeks after immunization with a single vaccine dose or with a control (PBS)
11.5 Challenge test 2 (Booster)
11.5.1 Relative percentage survival (booster)
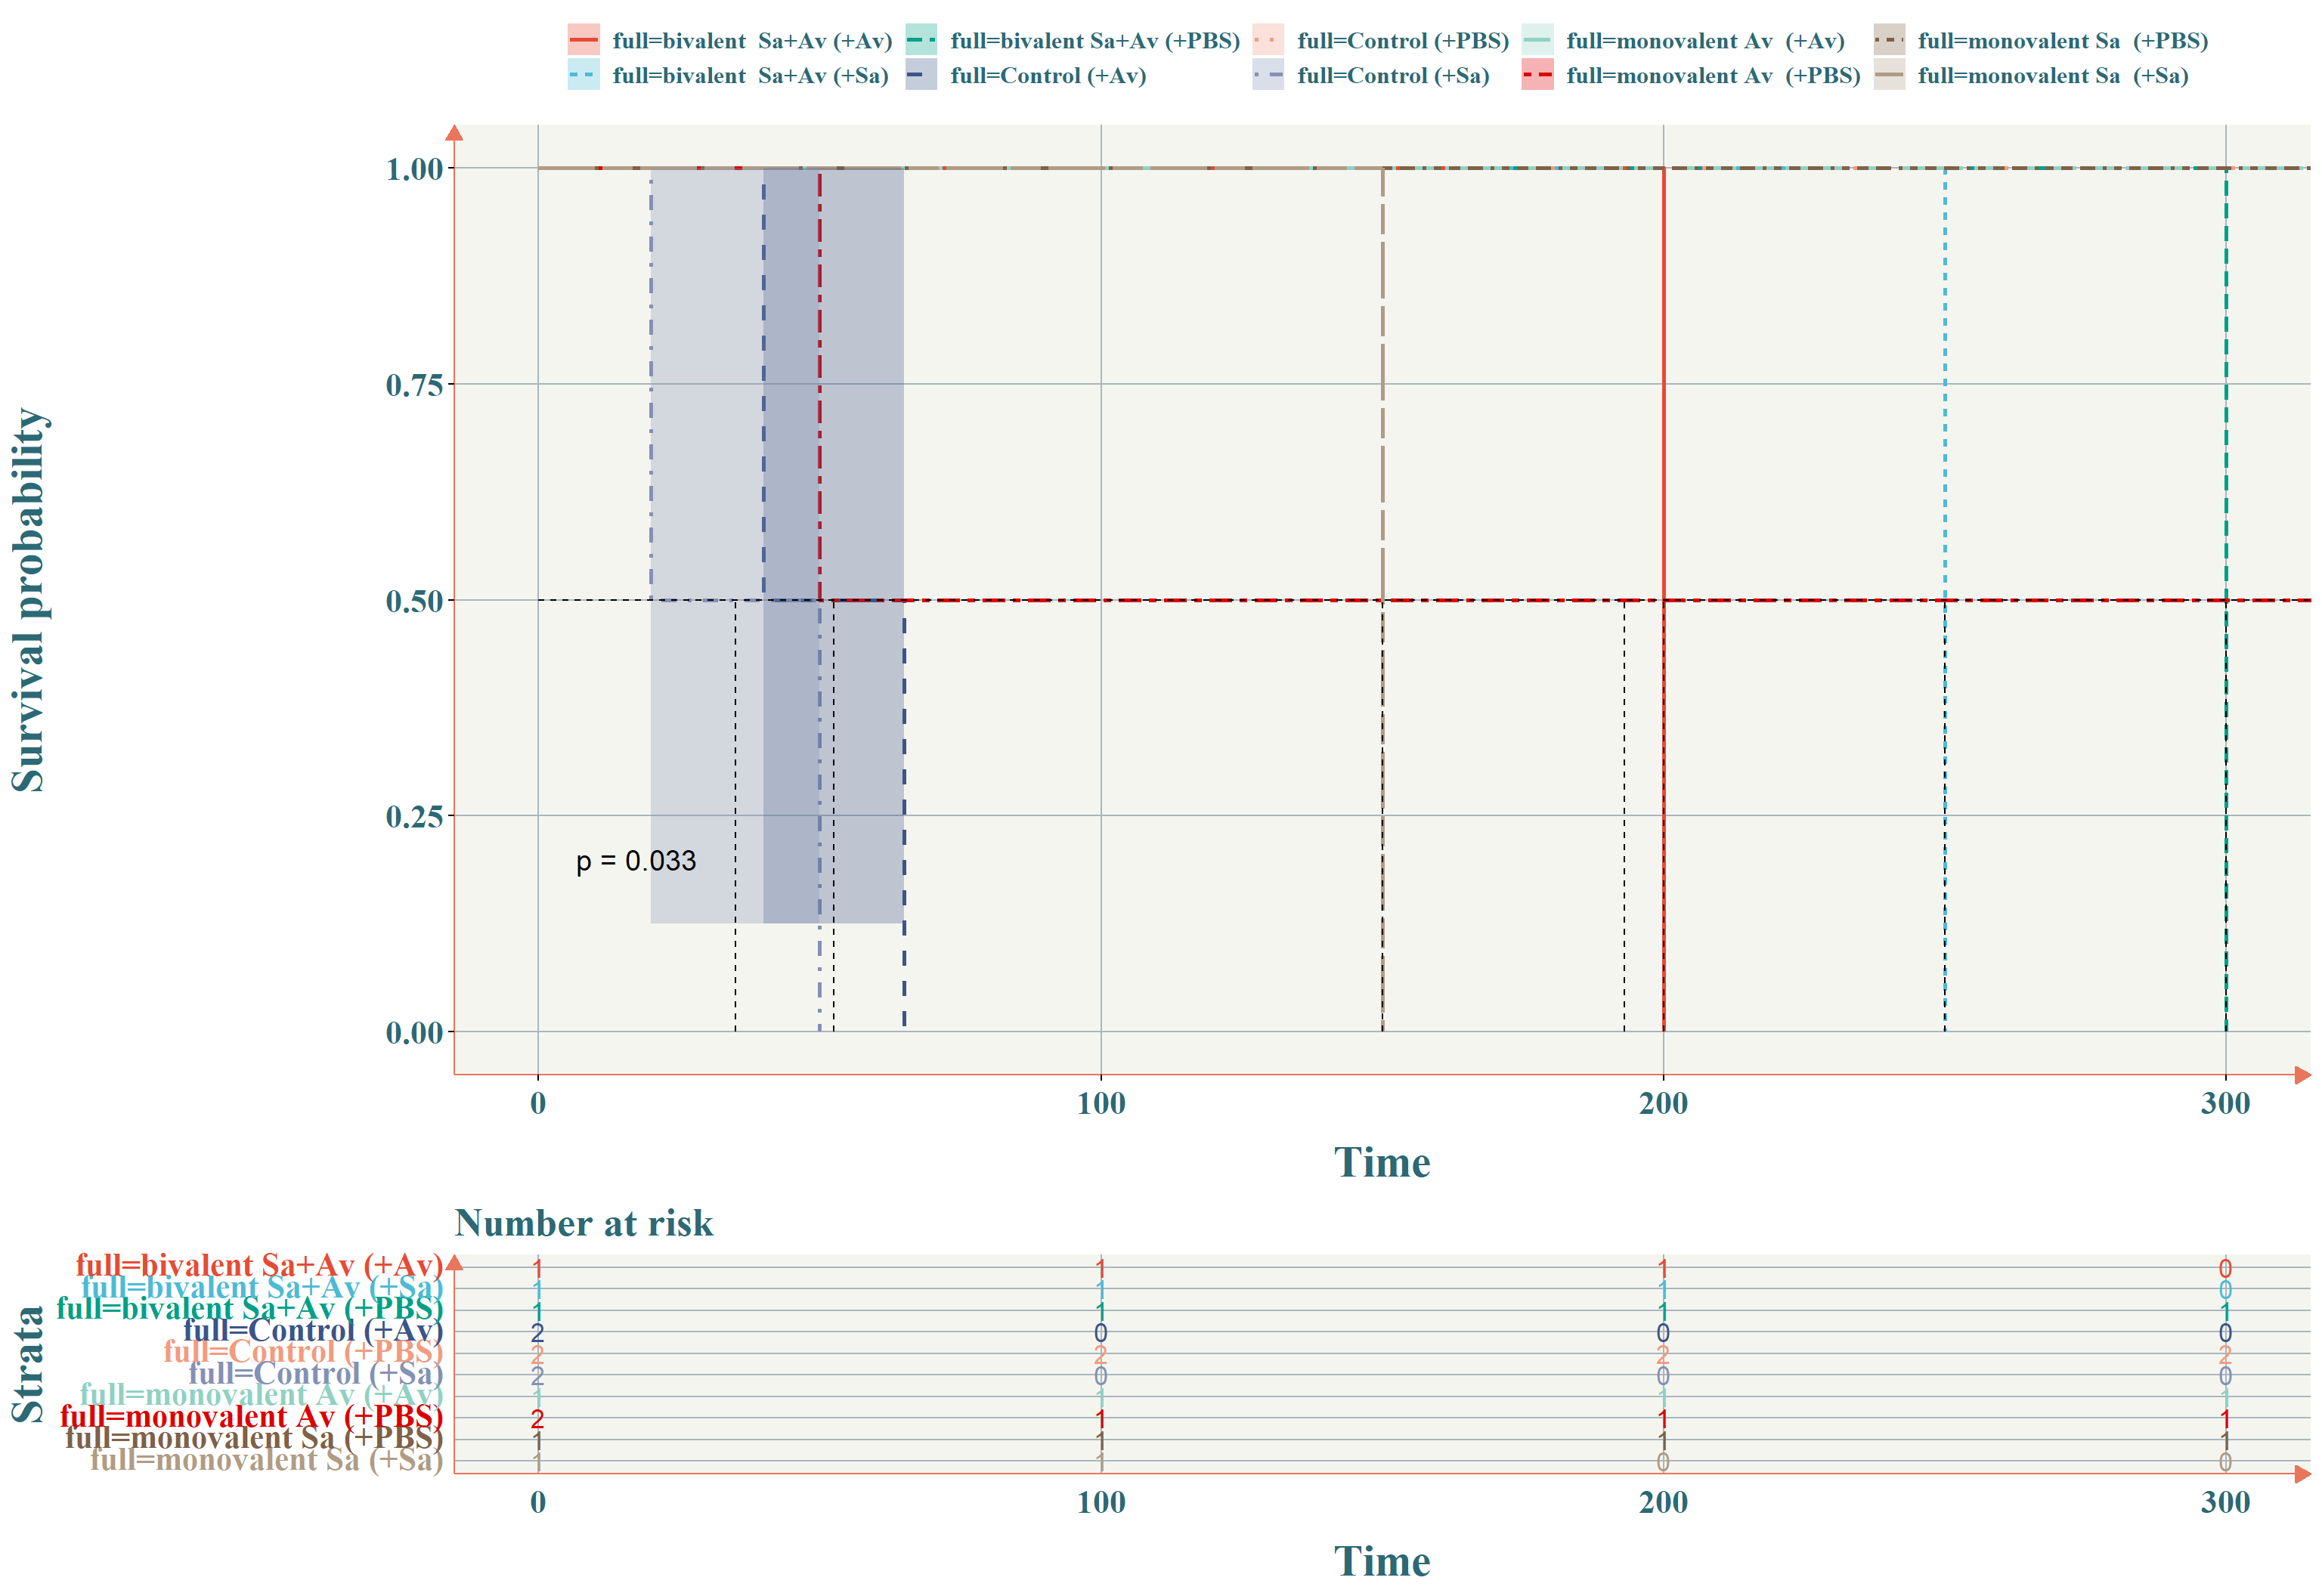
Figure 11.9: Survival rates of samples of 20 fish Nile tilapia challenged 12 weeks after immunization with two vaccine doses (primary + booster) or with a control (PBS)
11.5.2 Kaplan-Meier survival estimates for the second challenge test
Monovalent versus bivalent formulations
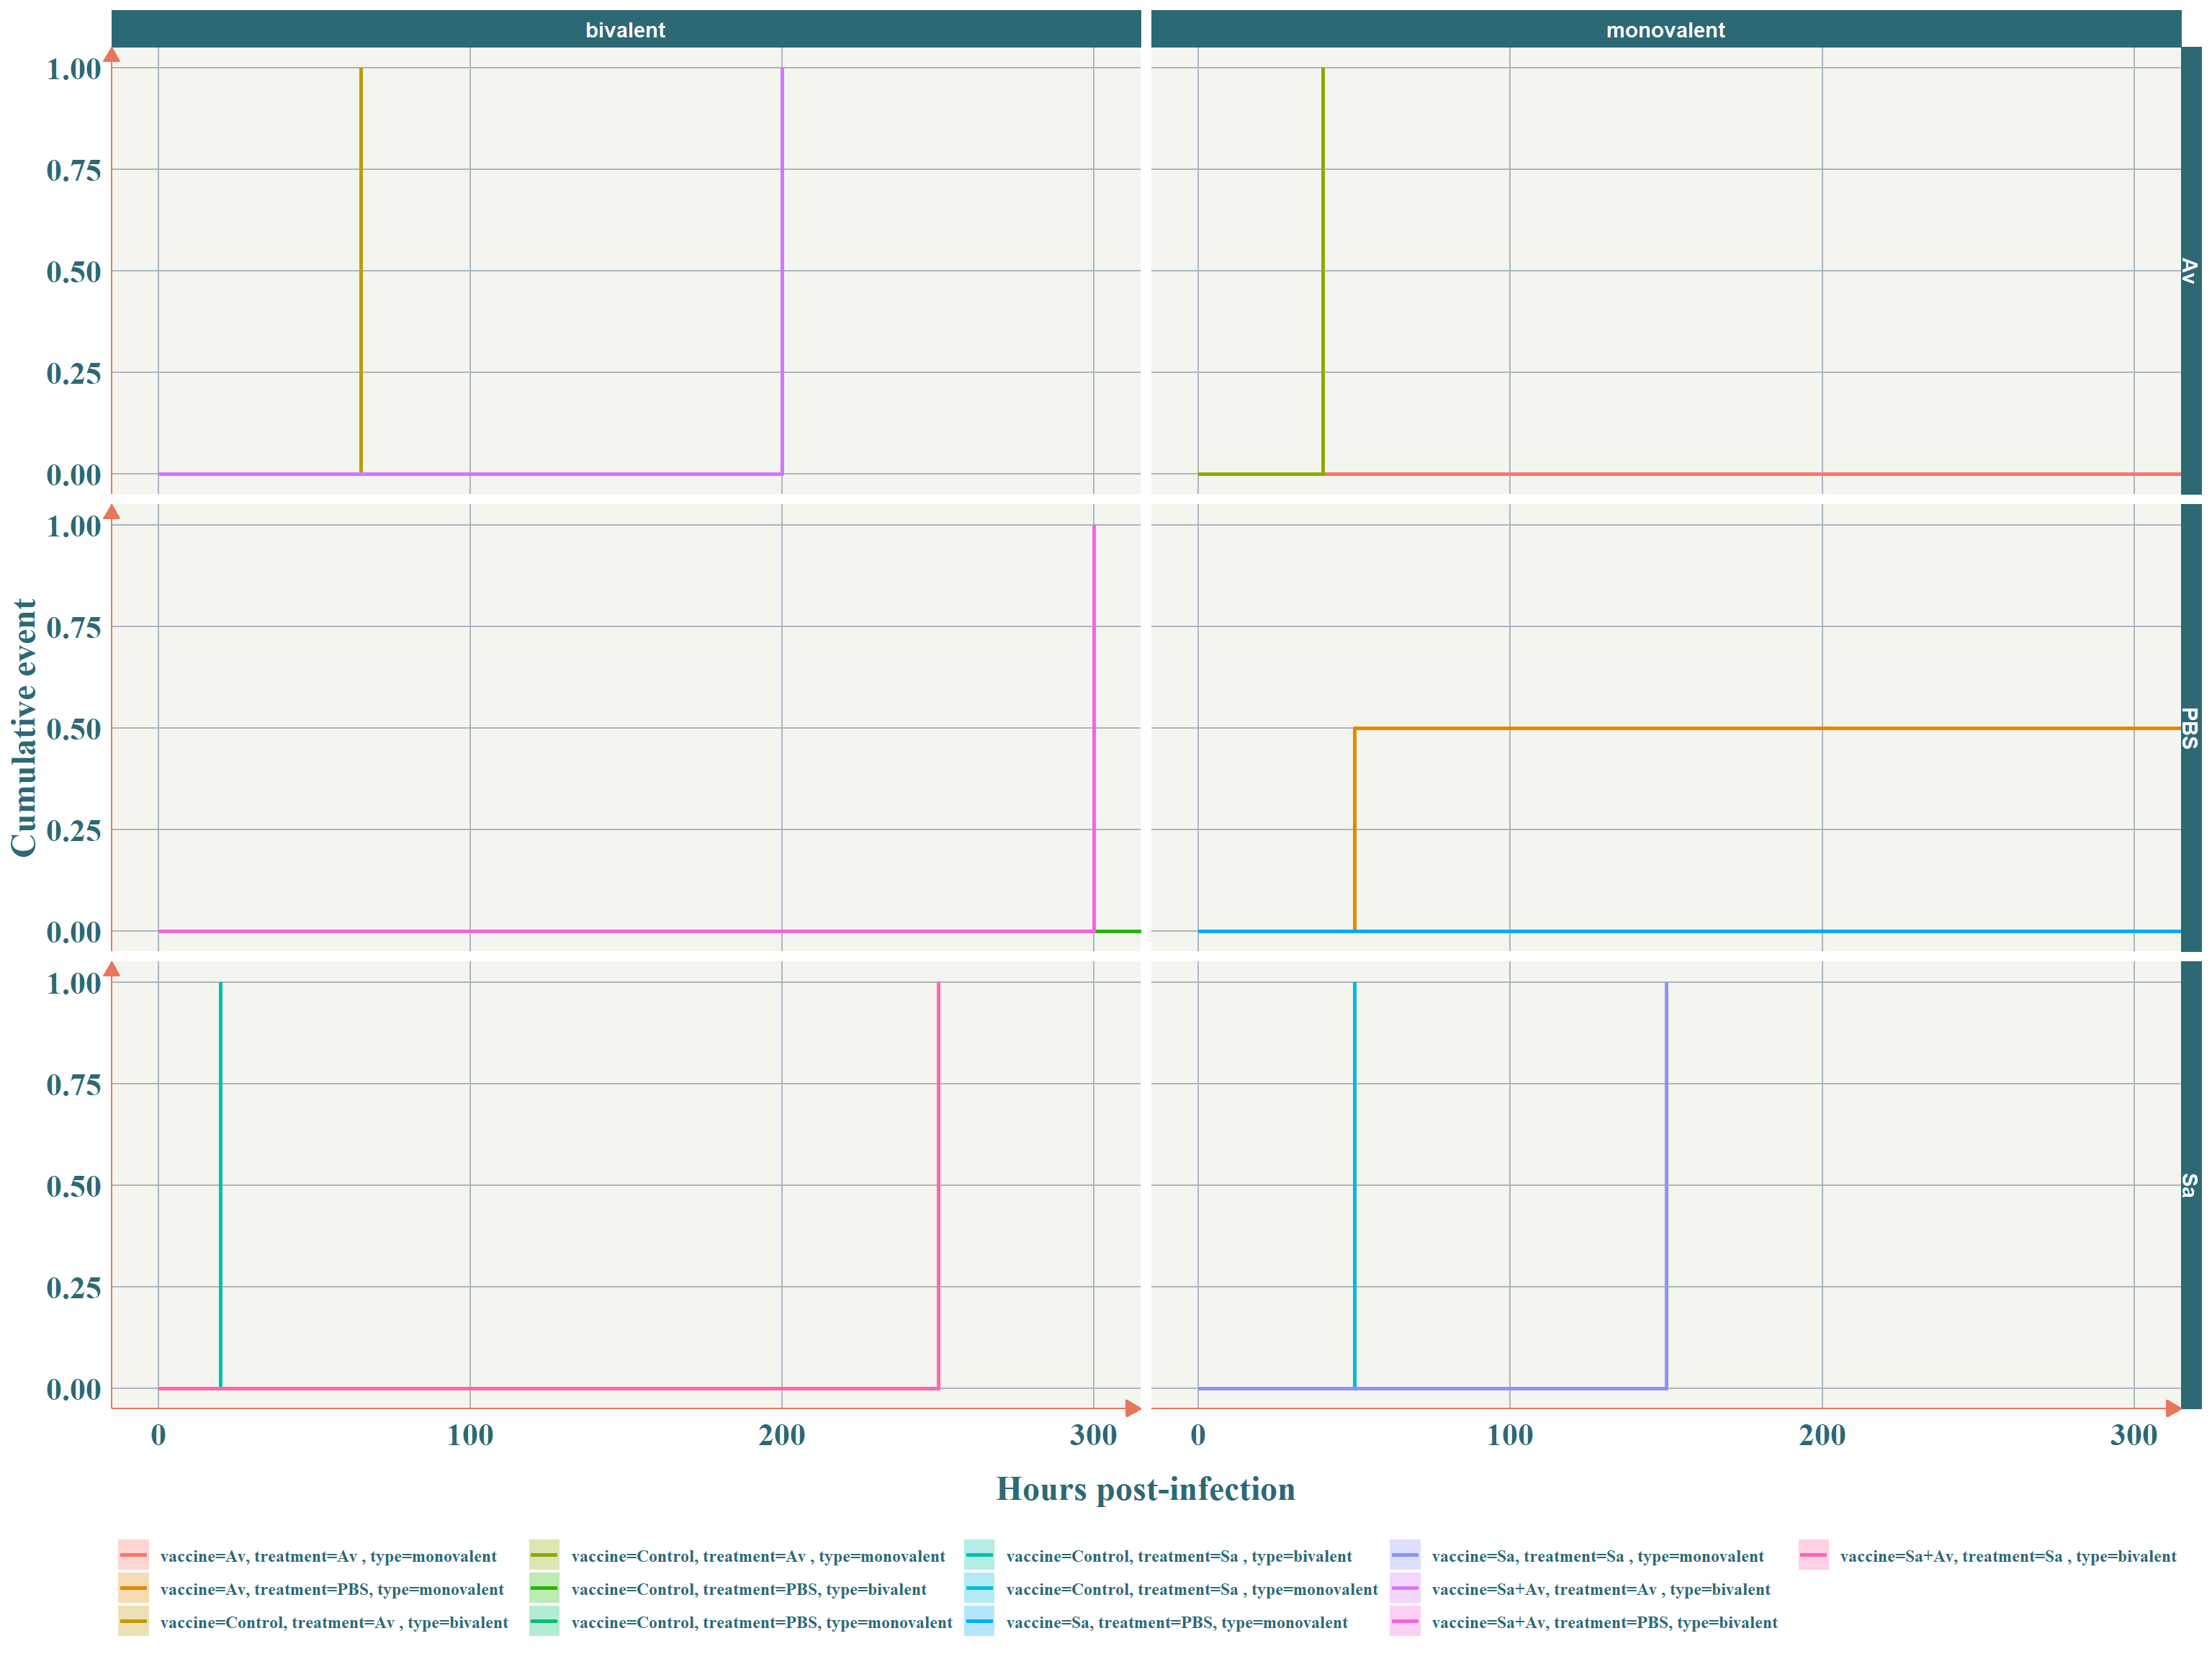
Figure 11.10: Survival curves using the combination of multiple factors. 20 fish Nile tilapia were challenged 12 weeks after immunization with two vaccine doses (primary + booster) or with a control (PBS)